The data Samples are rescaled by:
color_scale = (end_color-start_color+1)/2.0
start_color = 38
end_color   = 253
raster[*] = offset + scale * color_scale * Sample[*]
then clipped to the color scale range and converted to single bytes before sending the data back to XSD. The "
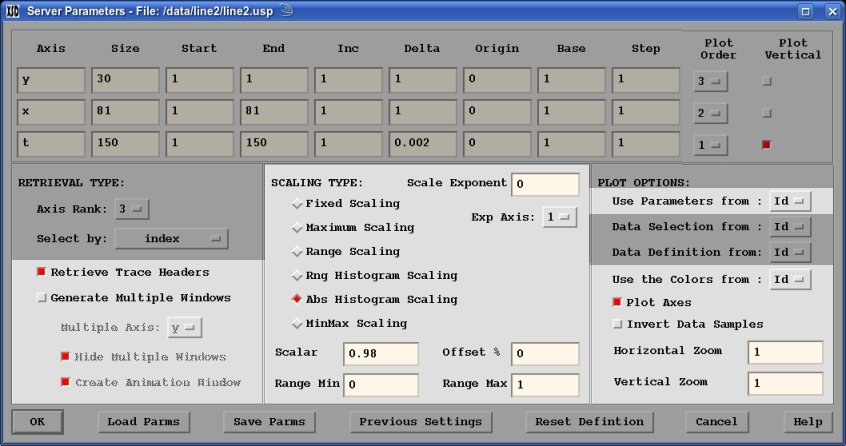
Scalar", "Offset",
"Range Min" and "Range Max" are used to define this
scaling, depending on the type of scaling selected. Only the parameters that
are used for any selected type is enabled.
- Fixed Scaling:
scale = Scalar*color_scale
offset= start_color + color_scale * (1+Offset/50)
- Maximum Scaling:
scale = Scalar*color_scale/max(abs(Samples[*]))
offset= start_color + color_scale * (1+Offset/50)
- Range Scaling:
scale = 2*color_scale/(Range Max-Range Min)
offset= start_color - scale*Range Min
- Rng Historgram Scaling:
max = Scalar percentile fraction of amplitude range
min = (1-Scalar) percentile fraction of amplitude range
scale = Scalar*2*color_scale/(max-min)
offset= start_color - scale*min
- Abs Histogram Scaling:
max = Scalar percentile fraction of absolute amplitude range
scale = color_scale/max
offset= start_color + color_scale*(1+Offset/50)
- MinMax Scaling:
min = min(Samples[*])
max = max(Samples[*])
scale = Scalar*2*color_scale/(max-min)
offset= start_color + color_scale - Scalar*(max+min)/2
By selecting a non-zero value for "
Scale Exponent", exponential
scaling will be applied on the axis specified by "Exp Axis:".
For example if exponential is done on the first axis, then the Samples are
scaled by:
Samples[i] = Samples[i] * (i-1)**Scale Exponent
- Select the parameters used for a currently displayed window by selecting the Window Id # from the "Use Parameters from:" option list.
- Select the colormap used for a currently displayed window by selecting the Window Id # from the "Use the Colors from:" option list.
- Set the "Plot Axes" toggle to plot the Axis annotation
- set the "Invert Data Samples" to plot the data inverted
- Zoom in on the data by selecting the axis zoom factors ("Horizontal Zoom" and "Vertical Zoom") for each desired horizontal or vertical direction.
- Set the "Retrieve Trace Headers" toggle if you want the trace headers passed to xsd from the ddsServer.
- Set the "Generate Multiple Windows" toggle to generate multiple windows at once. A window will be displayed for each selected value for the axis defined by the "Multiple Axis:" selection. If "Hide Multiple Windows" is selected, then the windows will come up as "Hidden" windows (windows can be exposed either thru the Window→Expose or Window→Global menu selection). If "Create Animation Window" is selected, then the windows will also be put into an "Animation Window".